Energy Efficiency Operating Indicators (EEOI) for Baltic Exchange Routes
1. Introduction
This document outlines the proposed incorporation of the Energy Efficiency Operating Indicator (EEOI) as a Baltic Exchange administered market comparison and benchmarking tool. The proposed system will calculate indicative EEOI values for commonly plied maritime trade routes using standard vessel characteristics and publish these to the market in a way that is similar to the existing Baltic Exchange indices. Such reference benchmarks will provide the shipping industry with a valuable point of reference and comparison as the market seeks to understand the inherent variability in operating efficiencies across routes and size classes and take practical steps to minimise its carbon footprint.
This document is a starting point for the Baltic Exchange EEOI benchmarks. Members will contribute their findings and vessel operating performance to validate and update the route EEOI assumptions and values, ensuring they reflect as close as possible the actual performance of vessels.
To ensure the standard vessel characteristics and reference EEOI values remain useful over time, the Baltic Exchange also proposes to work with members through forums and working groups to reflect actual EEOI figures for the routes in question. This activity mirrors the change process that the Baltic governs in relation to the standard Baltic vessel descriptions and routes.
2. An overview of the Energy Efficiency Operating Indicator
The International Maritime Organisation's (IMO) initial strategy on greenhouse gas reduction sets out sectoral targets to reduce absolute emissions from global maritime activity by 50% in 2050 compared to 2008 levels. Combined with increasing scrutiny by regional organisations and national governments and the advent of numerous sectoral initiatives focused on emissions reduction, tackling the challenge of maritime decarbonisation is a priority across the shipping industry.
Alongside publishing sectoral emissions targets, a suite of metrics and indicators has been developed and endorsed by the IMO and other maritime bodies to support and measure the industry's progress towards its carbon reduction goals. One of these metrics is the Energy Efficiency Operating Indicator (EEOI), an IMO endorsed (MEPC Circ. 684-Guidelines for Voluntary Use of the Ship Energy Efficiency Operational Indicator (EEOI)) measure developed to help monitor and quantify emissions and vessel operating efficiency. The EEOI is the ratio of a vessel’s CO2 emissions to work performed and is a complementary measure to the Energy Efficiency Design Index (EEDI). The EEDI provides indicative information on a vessel's achievable efficiency based on its design characteristics and distance travelled in a year. In contrast, the EEOI provides insight into a vessel's actual efficiency on the water.
The EEOI is used for understanding and monitoring the operating efficiency of individual vessels for a particular voyage . Z voyage consists of a ballast to a load port, load cargo and then proceed laden to a discharge port and discharge the cargo. More recently, however, the measure has also gained traction to measure portfolio efficiency across a fleet of vessels or activities. An annualised, weighted-average portfolio level calculation of the EEOI serves as the primary metric used by the Sea Cargo Charter (SCC) to track organisational alignment to IMO decarbonisation trajectories.
3. Calculating the Energy Efficiency Operating Indicator
Vessel operating efficiency may vary between voyages for numerous reasons. The amount of cargo carried, fuel consumed in ballast, changes in speed or behaviour, maintenance measures such as hull cleaning, or the installation of new components which impact the vessel's operating profile can all cause efficiency variation over time and from voyage to voyage. The EEOI provides visibility of the impacts of such changes. At the vessel level, repeated per voyage calculation of the EEOI provides valuable insight into a vessel's actual efficiency on the water across its life span.
The EEOI is defined by the IMO as the ratio of mass of CO2 emitted per unit of transport work done. For a given voyage, this can be presented as:
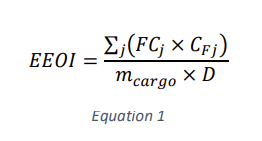
Where EEOI is the Energy Efficiency Operating Indicator, j the fuel type, FCj the mass of fuel consumed during the voyage (including the port time and ballast leg), CFj the CO2 conversion factor for fuel j, mcargo the mass of cargo carried (or equivalent work done) and D the laden distance in nautical miles.
For tankers and dry bulk carriers, the mass of cargo is expressed as metric tonnes of cargo carried. Conversion factors for common fuels are displayed in Table 1.
Table 1 Fuel Type conversion factors for use in EEOI calculations
| Fuel Type | Reference | Carbon Content | Conversion factor (tonnes of Co2 produced per tonne of fuel consumed) |
| Diesel/Gas Oil | ISO 8217 Grades DMX through DMC |
0.875 | 3.206000 |
| Light Fuel Oil (LFO) | ISO 8217 Grades RMA through RMD |
0.86 | 3.151040 |
| Heavy Fuel Oil (HFO) | ISO 8217 Grades RME through RMK |
0.85 | 3.114400 |
| Liquified Petroleum Gas (LPG) | Propane Butane |
0.819 0.827 |
3.000000 3.030000 |
| Liquified Natural Gas (LNG) | - | 0.75 | 2.750000 |
Equation 1 allows the calculation of the EEOI on a per vessel, per voyage basis, using vessel measurements commonly known and communicated as part of everyday operations and noon reporting.
4. Creating EEOI reference values for Baltic standard vessels and routes
It is possible to calculate actual EEOI values for given vessels and fleet portfolios, allowing the examination of changes in efficiency over time. In addition, it is also often useful to compare values across similar vessels and portfolios for a given snapshot in time. Such a frame of reference would be a helpful market comparison tool for organisations engaged in commercial maritime trade, seeking to meet targets related to their carbon footprint and operating efficiency levels. However, whilst vessel owners and operators may have access to such information on their own fleets, a lack of available reference data makes market level comparisons more challenging.
To address this, the Baltic Exchange has calculated indicative EEOI reference values based on Baltic standard vessel characteristics trading on the Baltic standard routes. The approach generates values for all the routes on which the Baltic Exchange already publishes a freight index, "Baltic Route EEOI values" (BREEOI).
Table 3 outlines the steps in the calculation methodology used to calculate the BREEOI:
Table 2 Baltic Exchange Reference EEOI Calculation Methodology
| Step | Details |
| 1. | Define the characteristics of the standard vessel to be used in the reference EEOI calculation, including: a) Cargo carried as restricted by deadweight, stowage factor or draft b) Fuel consumption rates for laden and ballast legs, and whilst in port c) Steaming speed on laden and ballast legs |
| 2. | Define the physical characteristics of the route in question, including: a) Laden and ballast leg distances b) Distance of any route portions where relevant fuel type regulations are applicable (e.g. Emission Control Areas) |
| 3. | Calculate the total of each type of fuel consumed using consumption rates, steaming speeds and voyage distance information |
| 4. | Convert the fuel consumption values into CO2 emissions using the conversion factors outlined in Table 1 |
| 5. | Calculate the work done on the reference voyage by multiplying the cargo tonnage by laden distances |
| 6. | Calculate the reference EEOI value for the route and vessel size by dividing the CO2 emissions figure by the calculated work done |
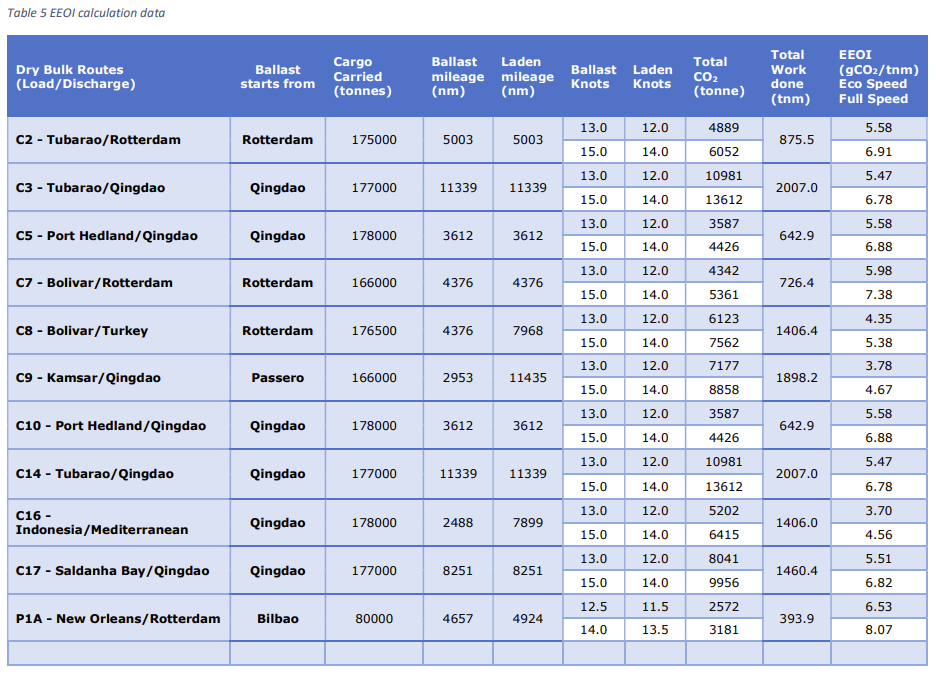
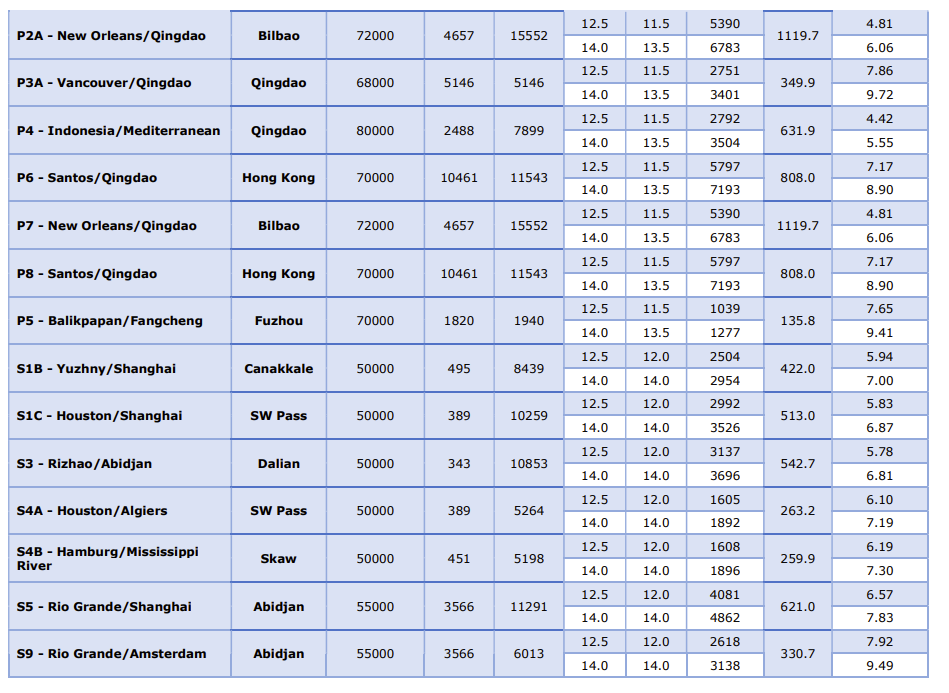
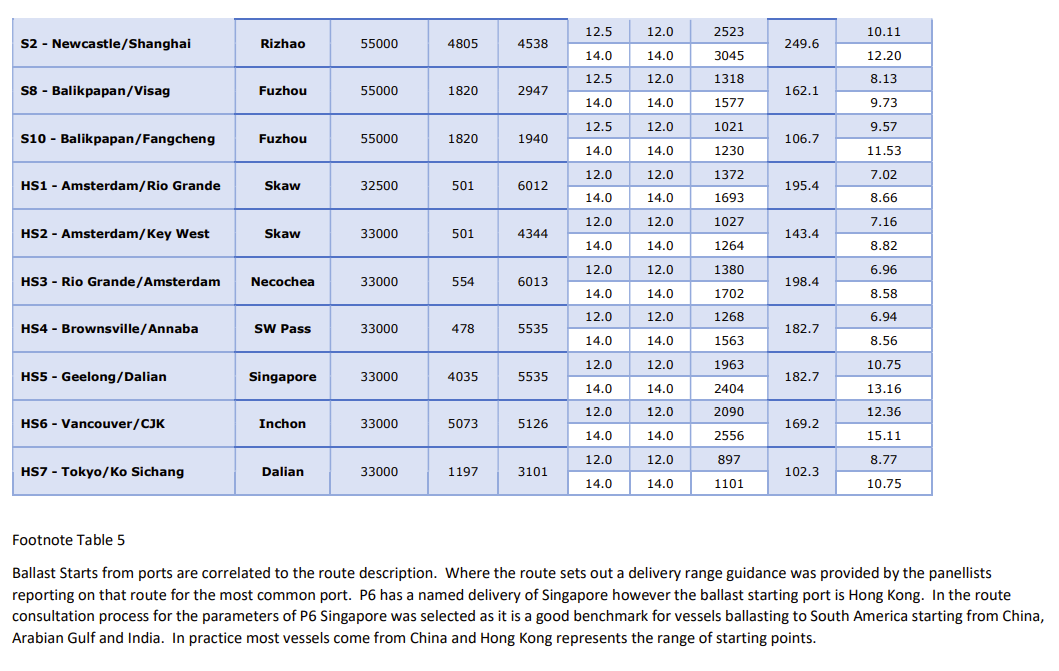
Table 3 shows example calculation values for Capesize Route C2 (Tubarao to Rotterdam) using both full and Eco speed steaming regimes.
Table 3 Standard values used in the Reference EEOI calculation for Capesize route C2 - refer to Table 5
| Parameter | Value at Full Speed | Value at Eco Speed |
| Cargo carried (tonnes) | 175,000 | 175,000 |
| Laden fuel consumption g/pd | 62000000 | 43000000 |
| Ballast fuel consumption g/pd | 62000000 | 43000000 |
| At-port fuel consumption g/pd | 4000000 | 4000000 |
| Laden leg steaming speed (knots) | 14 | 12 |
| Ballast leg steaming speed (knots) | 15 | 13 |
| Laden leg mileage (nm) | 5003 | 5003 |
| Laden ECA mileage (nm) | 424 | 424 |
| Laden non-ECA mileage (nm) | 4579 | 4579 |
| Ballast leg mileage (nm) | 5003 | 5003 |
| Ballast leg ECA mileage (nm) | 417 | 417 |
| Ballast leg non-ECA mileage (nm) | 4586 | 4586 |
| CO2 emissions produced (g) | 6052158288 | 4888582067 |
| Work done (tnm) | 8755250000 | 87552500 |
| Reference EEOI value (gCO2/tnm) | 6.91 | 5.58 |
BREEOI values are calculated based on the vessel operating both at Full speed and a slower but more economical speed (Eco speed). Performing the voyage at Full or Eco speed impacts the amount of fuel consumed (CO2 emitted) and the time taken to perform the voyage.
| Route | BREEOI Route Values | ||
| Full BREEOI |
Eco BREEOI |
Delta Eco-Full |
|
| C2 | 6.91 | 5.58 | -1.33 |
| C3 | 6.78 | 5.47 | -1.31 |
| C5 | 6.88 | 5.58 | -1.30 |
| C7 | 7.38 | 5.98 | -1.40 |
| C8 | 5.38 | 4.35 | -1.02 |
| C9 | 4.67 | 3.78 | -0.89 |
| C10 | 6.88 | 5.58 | -1.30 |
| C14 | 6.78 | 5.47 | -1.31 |
| C16 | 4.56 | 3.70 | -0.86 |
| C17 | 6.82 | 5.51 | -1.31 |
| P1A | 8.07 | 6.53 | -1.55 |
| P2A | 6.06 | 4.81 | -1.24 |
| P3A | 9.72 | 7.86 | -1.86 |
| P4 | 5.55 | 4.42 | -1.13 |
| P6 | 8.90 | 7.17 | -1.73 |
| P7 | 6.06 | 4.81 | -1.24 |
| P8 | 8.90 | 7.17 | -1.73 |
| P5 | 9.41 | 7.65 | -1.75 |
| S1B | 7.00 | 5.94 | -1.06 |
| S1C | 6.87 | 5.83 | -1.04 |
| S3 | 6.81 | 5.78 | -1.03 |
| S4A | 7.19 | 6.10 | -1.09 |
| S4B | 7.30 | 6.19 | -1.11 |
| S5 | 7.83 | 6.57 | -1.26 |
| S9 | 9.49 | 7.92 | -1.57 |
| S2 | 12.20 | 10.11 | -2.09 |
| S8 | 9.73 | 8.13 | -1.60 |
| S10 | 11.53 | 9.57 | -1.96 |
| HS1 | 8.66 | 7.02 | -1.64 |
| HS2 | 8.82 | 7.16 | -1.66 |
| HS3 | 8.58 | 6.96 | -1.62 |
| HS4 | 8.56 | 6.94 | -1.62 |
| HS5 | 13.16 | 10.75 | -2.42 |
| HS6 | 15.11 | 12.36 | -2.75 |
| HS7 | 10.75 | 8.77 | -1.99 |
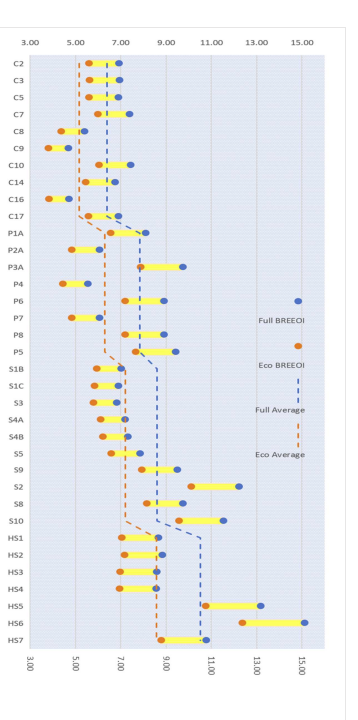
Figure 1
Observations
As expected, the Eco BREEOI values shown in Figure 1 are lower than the Full BREEOI values, a vessel operating at slower speed emits less CO2 and carries the same amount of cargo (same amount of work) as a vessel performing at full speed on the same voyage.
- The larger vessels, on average, have lower EEOI scores than smaller counterparts reflecting their overall improved efficiency compared with smaller vessels.
- The routes with a more significant ballast to the laden leg generally have higher EEOI values
- Smaller vessels with a more significant ballast to laden leg will generally see more impact as a result of slow steaming than a larger vessel.
5. Calculating an Annual Operating Energy Efficiency value The IMO uses two definitions of carbon intensity, the EEOI and the Annual Efficiency Ratio (AER); both are a ratio of CO2 emissions and work done.
EEOI represents the ratio of CO2 emissions and work done for a specific voyage, whereas AER represents the ratio of a year's CO2 emissions and the work done in the year, but with the following differences:
- EEOI calculates work as cargo carried multiplied by the distance of the laden leg
- AER calculates work as the deadweight of the vessel multiplied by total distance travelled in a year (ballast and laden)
The AER includes the ballast as work and ignores operational designs such as cubic capacity and deadweight draft ratios, as a result it assumes the vessel performs more work than the EEOI calculation.
To better represent an annual value the Baltic calculates an annual operating efficiency ratio based on the BREEOI calculations for each vessel size, Equation 3. An annual EEOI value reflects a vessel spot for one year (this is based on 360 trading days. Five days are assumed to be allowed for offhire, repairs where the vessel is not available for trading). To calculate a Baltic Annual EEOI (BAEEOI) the Baltic selects the same routes used for the Baltic weighted timecharter averages and applies the same weightings and a time factor.
Baltic Weighted Timecharter Averages are used by the dry bulk market to benchmark annual earnings. Routes and weightings for each vessel
- Cape 180,000dwt: C8=0.25, C9=0.125, C10=0.25, C14=0.25, C16=0.125
- Panamax 82,500dwt: P1A=0.25, P2A=0.1, P3A=0.25, P4=0.10, P6=0.30
- Supramax 58,328dwt: S1B=0.05, S1C=0.05, S2=0.20, S3=0.15, S4A=0.075, S4B=0.10, S5=0.05, S8=0.15, S9=0.075, S10=0.10
- Handysize38,200dwt: HS1=0.125, HS2=0.125, HS3=0.125, HS4=0.125, HS5=0.20, HS6=0.20, HS7=0.20
A vessel operating at Eco speed does less work in a year than at Full speed, it performs fewer voyages, and the TimeFactor takes this into account, Equation 2.
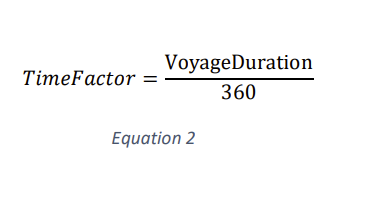
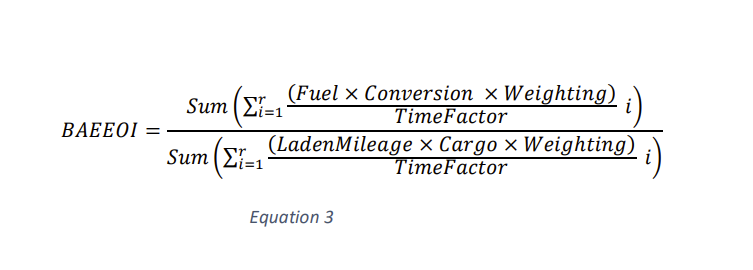
Figure 2 displays plots indicating the spread and distribution of BAEEOI differences within major size classes (Capesize 180,000dwt, Panamax 82,500dwt, Supramax 58,328dwt and Handysize 38,200dwt). A summary of key calculation information can be found in Table 5.
| Vessel Size | BAEEOI Values | ||
| Full Speed |
Eco Speed |
Delta | |
| Capesize | 5.75 | 4.65 | -1.10 |
| Panamax | 8.00 | 6.44 | -1.55 |
| Supramax | 8.62 | 7.25 | -1.37 |
| Handysize | 10.52 | 8.56 | -1.97 |
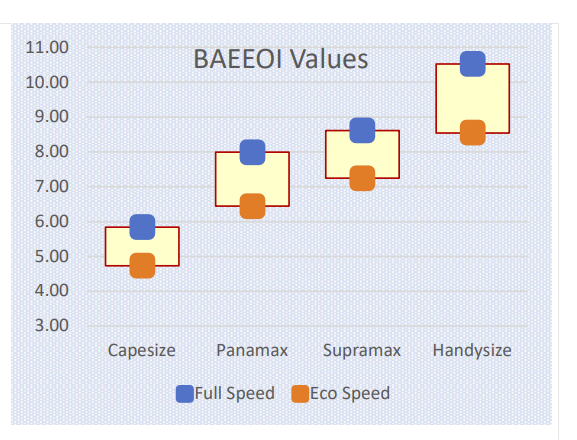
Figure 2
6. Calculating the annual carbon footprint
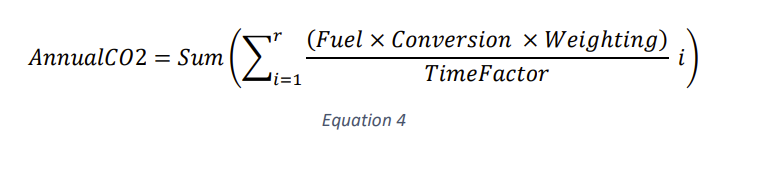
As set out in Table 2 step 4, the EEOI calculation process calculates the amount of CO2 by converting the fuel consumption into carbon emissions using the conversion factors outlined in Table 1. The annual amount of CO2 can be calculated, Equation 4, using the same routes and weightings to calculate the BAEEOI for each vessel size at Full and Eco speed.
| Vessel Size | Annualised Co2 |
|||
| (Tonne) | Eco-Full | |||
| Capesize | 55,445 | 39,801 | -15,644 | -28% |
| Panamax | 3,202 | 21,620 | -8,583 | -28% |
| Supramax | 28,791 | 21,575 | -7,216 | -25% |
| Handysize | 23,523 | 16,858 | -6,665 | -28% |

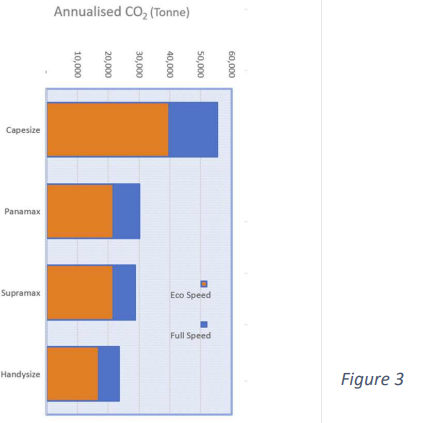
Observations
Figure 3 shows the CO2 emissions are less operating at Eco speed, which was expected, however only looking at the quantity of CO2 emitted overlooks that a vessel operating at slower speeds will carry less cargo in a year, or more ships are needed to carry the same amount of cargo.
7. Calculating the annual cargo carried
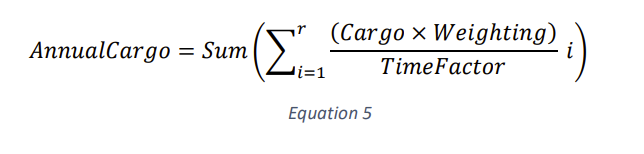
The annual amount of cargo carried can be calculated, Equation 5, using the same routes and weightings to calculate the BAEEOI for each vessel size at Full and Eco speed.
| Vessel Size | Annualised Cargo Carried | |||
| (Tonne) | Eco-Full | |||
| Full | Eco | Delta | % | |
| Capesize | 1,340,381 | 1,193,534 | -146,846 | -11% |
| Panamax | 519,414 | 463,032 | -56,382 | -11% |
| Supramax | 652,834 | 585,545 | -67,289 | -10% |
| Handysize | 442,253 | 390,121 | -52,132 | -12% |
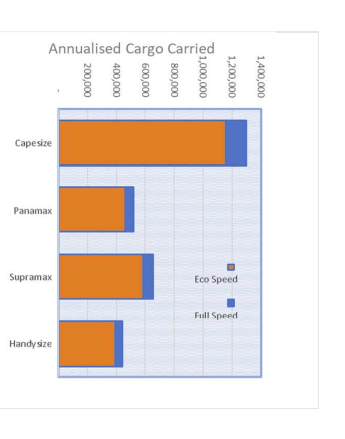
Figure 4
Observations
Figure 4 shows the calculated annual quantity of cargo carried in one year. When comparing the amount of cargo carried and the CO2 emitted in a year.
- A Capesize vessel carries 11% less cargo operating at Eco Speed and emit 28% less CO2
- A Supramax vessel carries 10% less cargo operating at Eco speed and emits 25% less CO2
This simplistic view would indicate it is better to have more vessels operating at Eco speed. The BAEEOI numbers imply an additional Capesize voyage at Eco speed will carry 170,000mt of cargo and emit 5,788 tonnes of CO2 for an averaged voyage. However, the carbon footprint of building more vessels, inefficiencies in positioning and many other factors such as enforcement of slow speed, need to be considered.
The main observation is that the ratio of CO2 emissions to work done enables comparison between vessels, the way they operate and are operated. It supports the IMO position to use a ratio calculation of CO2 and work done for the Carbon Intensity Indicator (CII) journey.
8. Comparing Sea Cargo Charter EEOI values with BAEEOI values
The Sea Cargo Charter (SCC - https://www.seacargocharter.org) is a maritime organisation set up to help signatories understand their operating carbon footprint and determine whether their overall emissions intensity aligns with IMO targets to reduce absolute emissions from global activity by 50% compared to 2008 levels. The EEOI is the primary metric used by the SCC to track and evaluate a signatory organisation's emissions footprint.
To determine alignment with IMO targets, the SCC has defined overall decarbonisation trajectories to be attained by signatories across their maritime activities. Decarbonisation trajectories are calculated pathways to reach IMO targets following progressive reductions in carbon intensity, as measured by the EEOI, over time. Each year, the SCC publishes data provided by signatories indicating whether their carbon intensities align with the requirements set by the decarbonisation trajectory. Because carbon intensities vary depending on ship type and size, as well as publishing annualised, aggregated figures of alignment for the entire portfolio of a signatory, the SCC also examines alignment within vessel size and type classes.
We compare the SCC required EEOI values with the Baltic Exchange's BREEOI and BAEEOI calculated values.
SCC Required EEOI values and Decarbonisation Trajectories
To determine climate alignment, SCC signatories reference annualised vessel EEOI figures to compare with decarbonisation trajectory derived required values. Because carbon intensity varies across vessels, EEOI values are provided for defined categories relating to vessel size and type.
Trajectory Values were calculated by examining the IMO target of a 50% reduction in emmissions compared with 2008, with additional allowance made for projected growth in shipping activity levels over time. Between the 2012 and 2050 callibration points, a linear trajectory is assumed, reflecting a constant improvement in carbon intensity figures over time. Technical guidance of the SCC is available on its website (https://www.seacargocharter.org/resources).
| Type | Min Size | Max Size | Unit | 2012 EEOI | 2020 EEOI | 2021 EEOI | 2022 EEOI |
| Bulk Carrier | 0 | 9999 | DWT | 44.5 | 36.7 | 35.73 | 34.75 |
| Bulk Carrier | 10000 | 34999 | DWT | 15.4 | 12.7 | 12.36 | 12.03 |
| Bulk Carrier | 35000 | 59999 | DWT | 11.7 | 9.65 | 9.39 | 9.14 |
| Bulk Carrier | 60000 | 99999 | DWT | 10.7 | 8.82 | 8.59 | 8.36 |
| Bulk Carrier | 100000 | 199999 | DWT | 5.83 | 4.81 | 4.68 | 4.55 |
| Bulk Carrier | 200000 | + | DWT | 5.13 | 4.23 | 4.12 | 4.01 |
| Chemical Tanker | 0 | 4999 | DWT | 51 | 42.06 | 40.94 | 39.83 |
| Chemical Tanker | 5000 | 9999 | DWT | 33.7 | 27.79 | 27.06 | 26.32 |
| Chemical Tanker | 10000 | 19999 | DWT | 23.7 | 19.55 | 19.03 | 18.51 |
| Chemical Tanker | 20000 | + | DWT | 15.6 | 12.87 | 12.52 | 12.18 |
| Liquefied Gas Tanker |
0 | 49999 | CBM | 30.4 | 25.07 | 24.41 | 23.74 |
| Liquefied Gas Tanker | 50000 | 199999 | CBM | 16.3 | 13.44 | 13.09 | 12.73 |
| Liquefied Gas Tanker | 200000 | + | CBM | 18.6 | 15.34 | 14.93 | 14.52 |
| Oil Tanker | 0 | 4999 | DWT | 70 | 57.73 | 56.2 | 54.66 |
| Oil Tanker | 5000 | 9999 | DWT | 48.2 | 39.75 | 38.7 | 37.64 |
| Oil Tanker | 10000 | 19999 | DWT | 36.4 | 30.02 | 29.22 | 28.43 |
| Oil Tanker | 20000 | 59999 | DWT | 24 | 19.79 | 19.27 | 18.74 |
| Oil Tanker | 60000 | 79999 | DWT | 16.5 | 13.61 | 13.25 | 2.89 |
| Oil Tanker | 80000 | 119999 | DWT | 13.2 | 10.89 | 10.6 | 10.31 |
| Oil Tanker | 120000 | 199999 | DWT | 10.8 | 8.91 | 8.67 | 8.43 |
| Oil Tanker | 200000 | + | DWT | 6.57 | 5.42 | 5.27 | 5.13 |
Table 4 SCC Required EEOI values for ship size/type categories
SCC EEOI values over time
The SCC process allows signatories to compare their carbon intensity alignment at the portfolio and category level with defined values mathematically derived from decarbonisation trajectories. However, whilst this comparison is helpful for showing progress towards overarching annual goals, it does not provide a mechanism for relative benchmarking based on voyages performed. Such a frame of reference would be a useful additional market comparison tool.
Comparing Sea Cargo Charter EEOI values with Baltic annualised EEOI values, BAEEOI
Figure 5 displays box plots indicating the spread and distribution within vessel sizes of the BAEEOI Full and Eco Speed over the SCC 2023 values.
| Vessel Size | Baltic Annual EEOI Values (BAEEOI) | ||
| Full Speed | Eco Speed | SCC EEOI | |
| Capesize | 5.75 | 4.65 | 4.58 |
| Panamax | 8.00 | 6.44 | 6.59 |
| Supramax | 8.62 | 7.25 | 7.75 |
| Handysize | 10.52 | 8.56 | 9.44 |
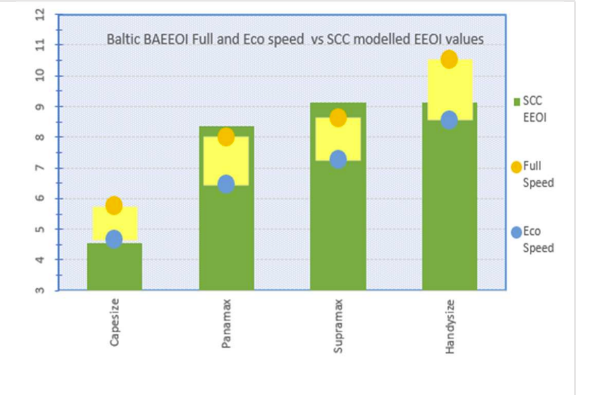
Figure 5
Observations
The Baltic BAEEOI values map well to the SCC values, in both Baltic and SCC values, larger vessels have lower EEOI scores than smaller counterparts reflecting their overall improved efficiency compared with smaller vessels
- All vessels, except capesize, performing at Eco speeds have BAEEOI values lower than the SCC
- Supramax and Handysize vessels are largely below the SCC requirement
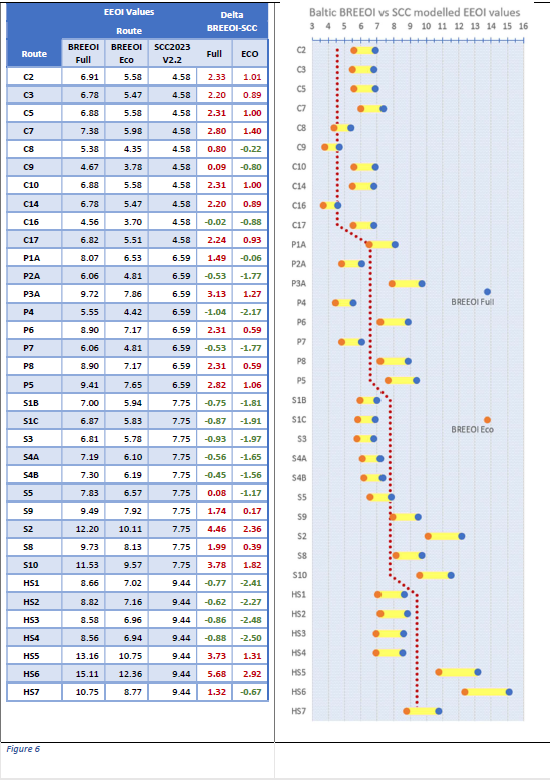
9. Comparing Sea Cargo Charter EEOI values with BREEOI values
Figure 6 plots the Baltic route EEOI values against the SCC 2022 target values.
10.Maintaining Values over time
As the profile of the global fleet evolves, so the reference EEOI values will need to change too. To ensure that the Baltic Exchange's EEOI postings remain a valid market reference point, the Baltic proposes following a similar approach to that employed in its day-to-day publishing of maritime market information. Members (or a panel thereof) provide the Baltic with periodic figures relating to EEOI (or its calculation constituents) for each of the assessed routes, which the Baltic can then use to maintain, and where necessary update, the benchmark reference value.
11.Conclusion
The production of indicative reference EEOI figures by the Baltic Exchange for common commercial trade routes provides maritime organisations with a novel operational sustainability indicator for market comparison and benchmarking.
The Baltic has an established process for managing changes to benchmarks and for working with members to ensure that they are relevant to the underlying market and ensure that the references figures published back to the market remain reflective of changes in the operating profile of the global fleet over time.
The Baltic Exchange is looking at providing EEOI calculation and certification service to members and acting as an external calculating body for members needing to provide EEOI information to third party organisations such as the Sea Cargo Charter.
Feedback on this paper is welcomed from members and non-members alike, any questions or interest in participating in this study please contact emissions@balticexchange.com.